Monitoring and observability with Grafana
Your friendly neighbourhood "Get me out of trouble"
Lately, I’ve realised that I’m getting old as a developer. It sounds funny - I know I’m only 28 years old - but I’ve noticed a shift. In the past, I’d get excited about design patterns and writing optimised code. Nowadays, what gets me excited is monitoring and observability.
This shift comes from a dark place we’ve all been to occasionally - extinguishing fires in production. If you’ve ever deployed your piece of code and seen a blank page, an API gone rogue or data getting corrupted, you know what I’m talking about. What I usually missed in those situations was - monitoring and observability.
As Amazon defined it (reference):
Monitoring computing systems is a practice as old as running computing systems themselves. The monitoring process collects data about a system to check if the system is operating as expected. It includes reports and alerts on errors, faults, or anomalous data values.
Observability brings a wider scope and visibility to traditional monitoring tools, incorporating extra situational and historical data and system interactions. It enables investigation into the root cause of monitoring alerts, alongside the ability to investigate issues that arise due to multi-component interactions.”
So far, I’ve used various tools to achieve this, from raw log files from your favourite framework to more sophisticated tools like AWS X-Ray, AWS CloudWatch, Datadog, Kibana, etc. These tools are great, and each has its strengths and flaws. However, the one that keeps me excited as a child is Grafana.
Why Grafana?
Well, for one thing, there’s an open-source version. This gives you complete control over where and how you will host your monitoring system.
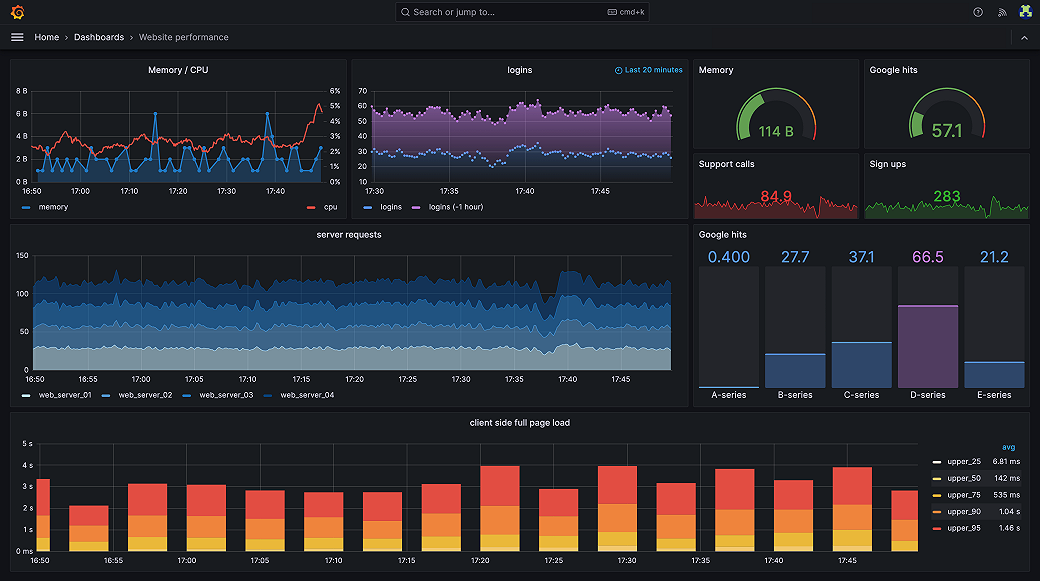
Along with that, the visualisations you can create are beautiful. Here’s an example of Grafana’s visualisation capabilities:
Given its open-source since 2014, in the 10 years that it exists, the community has really put a lot of effort into it and created various open-source tools that accommodate it like:
- Grafana Loki - multi-tenant log aggregation system,
- Grafana Mimir - metrics storage,
- Grafana OnCall - on-call management system,
- and many more.
What should I use it for?
The easiest answer - it depends. In my case, Grafana provided me with a quick way to draft a read-only UI for data from various places like databases, caches and log files. It gave me the ability to aggregate the data in a single place. This made it easier to process for whatever requirements I’ve been given.
It’s useful to both business and developers. For business, it improves visibility on the data they own at a low cost. For developers, it improves the developer experience giving a high level of observability (proceed with caution, this depends on you).
There are practically no limitations, whatever you want to expose, you can expose to it. It’s a great way to have your infrastructure, application and data in a single place.
Okay, you got me, so how can I start using it?
Probably the easiest way you can start with Grafana is using Docker. The documentation on Grafana around this is great and you can really start playing around quickly.
There is only one command separating you from your first Grafana experience:
docker run -d -p 3000:3000 --name=grafana grafana/grafana-oss
The main difference between the open-source and enterprise version (aside from hosting) is in the support for enterprise plugins. So far, I’ve yet to find a limitation to this, because I’ve managed to cover my needs with the vast plugins that are available. The possibilities are endless.
What gets monitored gets improved
In the end, whatever you choose and wherever you are, I hope you understand the importance of monitoring and observability. If not, I hope this shed some light on it. And again, if not, maybe you just need to “grow old” as I did.
Monitoring and observability is your best friend because it prevents fires. It gives you clear visibility over what has to be improved and how urgent it is to improve it. It also gives you that same visibility in dark periods where you have to extinguish fires. Be nice to your friend.